


This article was authored in collaboration with ARK’s Director of Investment Analysis & Institutional Strategies Tasha Keeney, Client Portfolio Manager Thomas Hartmann-Boyce, Assistant Trader Julian Falcioni and Chief Financial Officer Paul Wilson.
For years, market pundits have been warning investors about “profitless tech”––companies ostensibly incapable of turning a profit. They describe stocks in ARK’s strategies as “concept capital” and suggest that our investment team either cannot distinguish profitable companies from unprofitable ones or seeks to invest in unprofitable companies. In our view, the companies in which we invest are sacrificing short-term profits to capitalize on the exponential growth and highly profitable opportunities that a number of innovation platforms are creating.[1] Companies catering to short-term oriented investors and leveraging their balance sheets to pay dividends or manufacture earnings with share repurchases do not seem to us to be investing enough to catch these waves of innovation. As a result, we believe many are likely to be disrupted, if not destroyed.
The profitless tech narrative seriously understates the profit potential of companies at the forefront of transformative innovation. Why does our view differ so significantly from that of the profitless tech pundits? Simply, our analysis and metrics gauge the growth and cash flow potential of companies investing in the future. We adjust EBITDA to normalize expenses that are investments and should be capitalized. In a company’s early days, a significant amount of research and development, stock-based compensation, and even sales and marketing are investments in platforms that ultimately will yield significant cash flow.
In this paper, we share our view on the profitability of early-stage companies and compare it to more common approaches.
- Section One describes the metric commonly used to assess profitability––US Generally Accepted Accounting Principles (GAAP)-based EBITDA.
- Section Two details ARK’s alternative approach to measuring profitability––ADJUSTED EBITDA.
- Section Three illustrates that the adjusted EBITDA of Tesla was positive when GAAP-based EBITDA was negative, tracking that relationship over time.
- Section Four discusses how inefficiently valued and underpriced disruptive innovation is today.
I. Reported EBITDA Based On GAAP
Earnings before interest, tax, depreciation, and amortization (EBITDA) is a standard measure of profitability. Accountants calculate EBITDA by removing various operating expenses from a company’s revenue. Expenses include the cost of revenue, sales and marketing, general and administrative costs, research and development, stock-based compensation and, in some cases, external market-driven goodwill impairment. Financial statements compiled in accordance with GAAP provide the building blocks of EBITDA. Often, short-term oriented traders, analysts, and portfolio managers distinguish “good” from “bad” earnings based on headline GAAP-based EBITDA.
While reliable for mature companies, we believe GAAP-based EBITDA is not a good gauge of profitability for younger companies investing aggressively to transform industries and scale into mass market opportunities. Why? Because GAAP-based EBITDA: (1) accounts for Research and Development (R&D) costs and other investments associated with early-stage growth companies as period expenses; and (2) includes non-cash items such as stock-based compensation and valuation impairments but does not include certain cash revenues that already have been collected. We discuss GAAP-based EBITDA’s shortcomings in the context of early-stage companies in more detail below.
Based on GAAP-based EBITDA, many ARK holdings appear unprofitable. Only 27.8% of the ARK Innovation ETF’s (ARKK) holdings[2] are EBITDA positive using Trailing Twelve Month (TTM) EBITDA based on GAAP numbers, as shown below. Note that both Tesla and Nvidia[3] break the mold, though Tesla was profitless based on GAAP-based EBITDA just five years ago.[4] In our view, thoughtful analysis is necessary to understand the underlying profitability of ARKK’s portfolio companies.
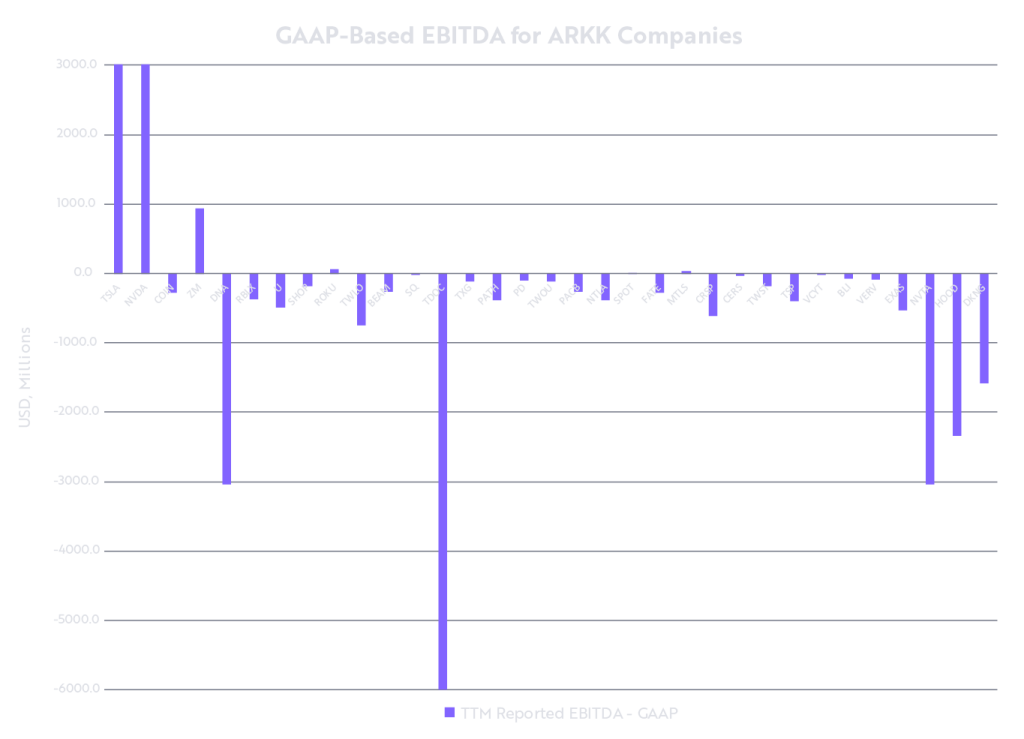
Source: ARK Investment Management LLC, 2022. Chart scaled to a maximum of $3 billion and minimum of -$6 billion. Data as of Q2 2022.
Forecasts are inherently limited and cannot be relied upon.
For informational purposes only and should not be considered investment advice or a recommendation to buy, sell, or hold any particular security or cryptocurrency.
Please see ARKK’s top ten holdings here: https://ark-funds.com/funds/arkk/
II. ARK’s Approach To Measuring Profitability
In our view, analysts should adjust the GAAP-based EBITDA associated with truly innovative companies for discretionary investments in research and development (R&D), the portion of selling and marketing (S&M) attributable to capturing market share, stock-based compensation (SBC), cash collected but not recognized as revenue, and market valuation-related impairments––as discussed below. In the following examples, we adjust GAAP-based EBITDA with normalized R&D, S&M and SBC,[5] adding back deferred revenue and, in two cases, the non-recurring asset impairment associated with acquisitions.
Based on those adjustments, 84.9% of ARKK’s holdings[6] would be EBITDA positive, as shown in the chart below. Specifically, “core profitability” reduces discretionary costs and investments––R&D, S&M, and SBC––as a percent of revenue to the levels associated with mature companies. As measured by the median for companies in the mature Nasdaq 100,[7] R&D, S&M, and SBC as a percent of revenue are 12%, 17.7%, and 3.2%, respectively. Also, we recognize the cash collected but classified by GAAP as deferred revenue and, in two cases, we eliminate non-cash asset impairments associated with general equity market conditions.
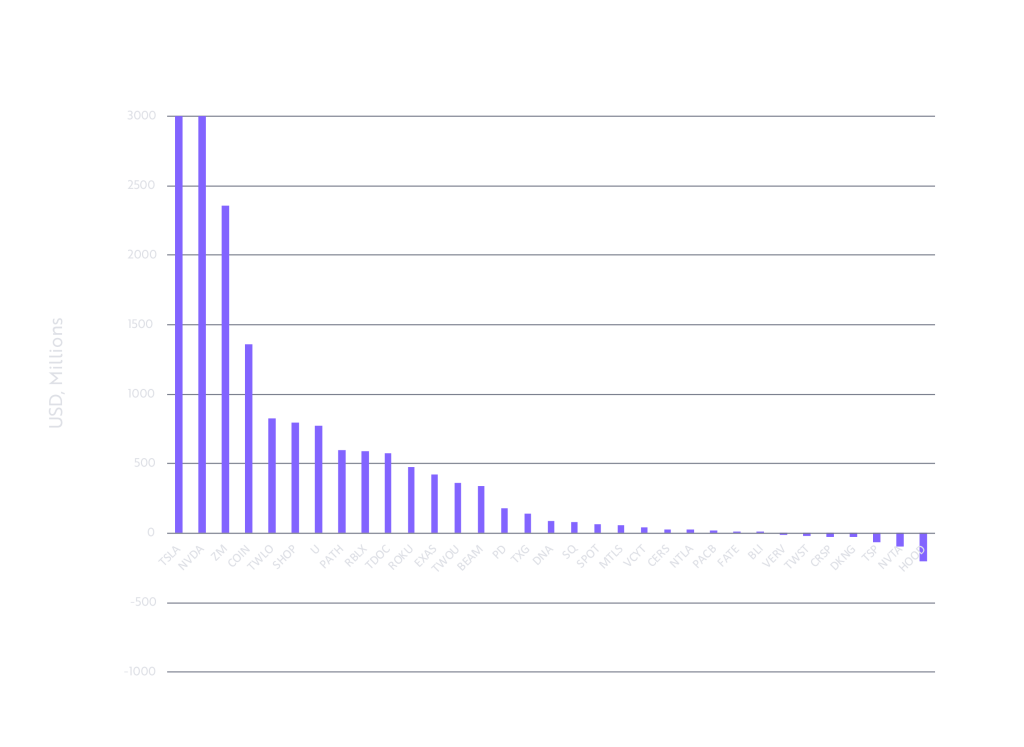
Source: ARK Investment Management LLC, 2022. Chart scaled to a maximum of $3 billion. Data as of Q2 2022.
Note: Asset impairment was added back for Teladoc and Invitae. We believe that is not indicative of the company’s profitability and discuss this point later in the article.
Forecasts are inherently limited and cannot be relied upon.
For informational purposes only and should not be considered investment advice or a recommendation to buy, sell, or hold any particular security or cryptocurrency.
Research and Development, Selling and Marketing, and Stock-Based Compensation
Compared with companies in the Nasdaq 100, spending on R&D, S&M, and SBC in ARKK’s much younger companies is disproportionately high relative to revenue, depressing GAAP-based EBITDA in the short term. While discretionary in the short term, R&D spending can create long-term value and typically declines as a percent of revenue as companies scale over time. Ignoring the value that R&D adds to early-stage companies, GAAP accounting treats it as an expense on the income statement. As a percent of company revenues, ARKK companies’ median R&D expense is 2.5x higher at 28.6% than the 12% for the Nasdaq 100. Meanwhile, ARKK companies’ median S&M is ~2x higher at 33.2% than the Nasdaq companies’ 17.7% and SBC is roughly 7x higher at 22.6% than the Nasdaq 100’s 3.2%. In total, the short-term drag on the GAAP-based EBITDA margins of early-stage growth initiatives is more than 50 percentage points!
Normalizing these costs, many of which are non-cash, highlights the latent profitability of early-stage companies. In mature companies, revenue growth typically has decelerated into single digit territory and R&D has dropped to a low percentage of revenue. In contrast, early-stage companies are reinvesting their cash to disrupt incumbents, capture market share, and accelerate top-line growth.
Interestingly, the US is unique in treating R&D as an expense on the income statement. The International Financial Reporting Standards (IFRS) apply to 120 countries[8] and, unlike GAAP, allow companies to capitalize and book a portion of development costs[9] as an asset. Fostering innovation to solve real-world problems and boost productivity, R&D does seem to be more of an asset than a liability.
While R&D’s role in latent profitability is understandable, perhaps SBC and S&M are less so. Based on stock valuations, SBC is a non-cash expenditure that is unlikely to impact a company’s sustainability and core cash profitability. SBC does, however, hit GAAP-based EBITDA, especially if early-stage companies reach lofty valuations and are attracting top talent. Further, we treat the S&M that mature companies spend on maintaining market share as an expense but consider incremental S&M spent on gaining market share as an investment, as the creation of a new customer base is an intangible asset.
Deferred Revenue
Generally representing cash collected for contracts that extend beyond the current accounting period, deferred revenue is not incorporated into GAAP-based EBITDA. Less meaningful for mature companies, deferred revenue can be a significant sign of validation for companies that have signed multi-year contracts, particularly when based on declining cost curves that will attract even more business. In our view, deferred revenue is cash in hand that will contribute to the sustainability and profitability of early-stage growth companies. As a result, adjusting GAAP-based EBITDA for deferred revenues can highlight the latent profitability of rapidly growing companies.
Asset Impairment
Recently, both Teladoc and Invitae incurred one-time charges for asset write-downs heavily influenced by market valuations that should not impact their growth and cash flow in the long term. In other words, an equity market drawdown hit them with losses unrelated to the underlying quality of their acquisitions. Importantly, we believe the acquisitions that Teladoc and Invitae made are both high quality in nature and strategic for long term growth. Teladoc’s biggest acquisition, Livongo, is bolstering its AI and chronic care capabilities, especially those related to diabetes, hypertension, and weight management. ArcherDx gave Invitae somatic testing capabilities associated with its proprietary AMP (Anchored Multiplex PCR) chemistry, a highly stable technique for surfacing rare cancer variants in blood and other low-input sample types.
Negative Normalized EBITDA
After normalizing for the factors discussed above, seven ARKK companies are generating negative EBITDA, as shown in the first chart above. Currently working on future technologies or treatments, three such companies are pre-revenue: (1) Verve Therapeutics, (2) CRISPR Therapeutics, and (3) TuSimple. Verve Therapeutics is a pre-commercial company investing heavily in cardiovascular gene-editing R&D which, if successful, we believe will generate explosive growth in revenues relative to operating expenses. CRISPR Therapeutics is working on gene-editing therapies to cure inherited diseases like beta thalassemia, sickle cell disease, cancer (CAR-T and CAR-NK), and diabetes, among others. TuSimple,[10] an autonomous trucking company, plans to launch a commercial product in 2023.[11] ARK expects autonomous trucking services to offer software-like margins. (4) Invitae, a molecular diagnostics company, does generate revenue, but its margins were hit predominantly by product mix shifts and underutilized fixed assets during COVID. Under new management, which has cut employment by a third and divested lower margin businesses, Invitae is poised to return to much higher margins. Meanwhile, (5) Twist Biosciences, a synthetic biology company, increased capital spending on a shipping facility that will double its production capacity and open in the next month. Finally, with unique strategies, (6) DraftKings is spending aggressively on promotions to cement its leading market share in sports betting, and (7) Robinhood’s stock-based compensation ballooned at the end of its post-IPO lockup period.
III. Tesla’s Profitability Over Time
In this section, we show that Tesla’s profitability was negative as measured by GAAP-based EBITDA until 2016 but, when adjusted, turned positive in 2015, five years before it entered the S&P 500. History has served this normalization process well, as shown below.
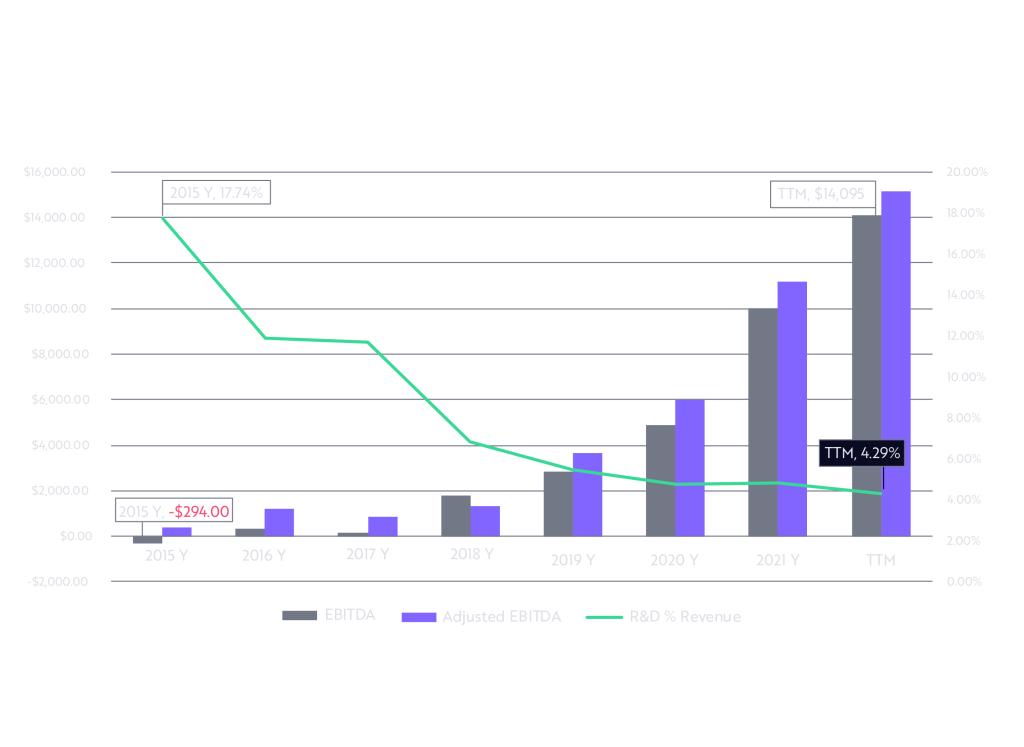
Source: ARK Investment Management LLC, 2022. Data as of Q2 2022.
Forecasts are inherently limited and cannot be relied upon.
For informational purposes only and should not be considered investment advice or a recommendation to buy, sell, or hold any particular security or cryptocurrency.
As Tesla invested and our normalized measure of profitability suggested, negative GAAP-based EBITDA ultimately turned positive and then soared in tandem with market share gains.
Centered on Wright’s law,[12] our financial models focus on the cost declines and subsequent gross margin expansion associated with scaling the unit production of a given technology. Specifically, for every cumulative doubling in the number of units produced, costs typically fall by a consistent percentage rate. Important in our financial modeling is the assumption that companies will maximize profitability in five years and will not re-invest aggressively for future growth, resulting in cash-flow and margin profiles similar to those of more mature companies.
IV. A Disconnect Between Revenue Growth And Valuation
High revenue growth accommodates rapid growth in operating expenses, R&D, and future EBITDA. In the trailing four quarters ended in the second quarter, ARKK companies delivered ~31% revenue growth on a year-over-year basis, roughly double the ~16% growth of companies in the Nasdaq 100, as shown below. In other words, ARKK’s companies have the added wherewithal to accommodate investments in the future. Nonetheless, the market is paying little for what we believe is superior growth potential, as ARKK’s median EV/adjusted EBITDA is ~12x, 20% LOWER than the Nasdaq-100’s 15x. This multiple gap is likely to close and move further in the opposite direction if investors shift their focus back to longer-term fundamentals.
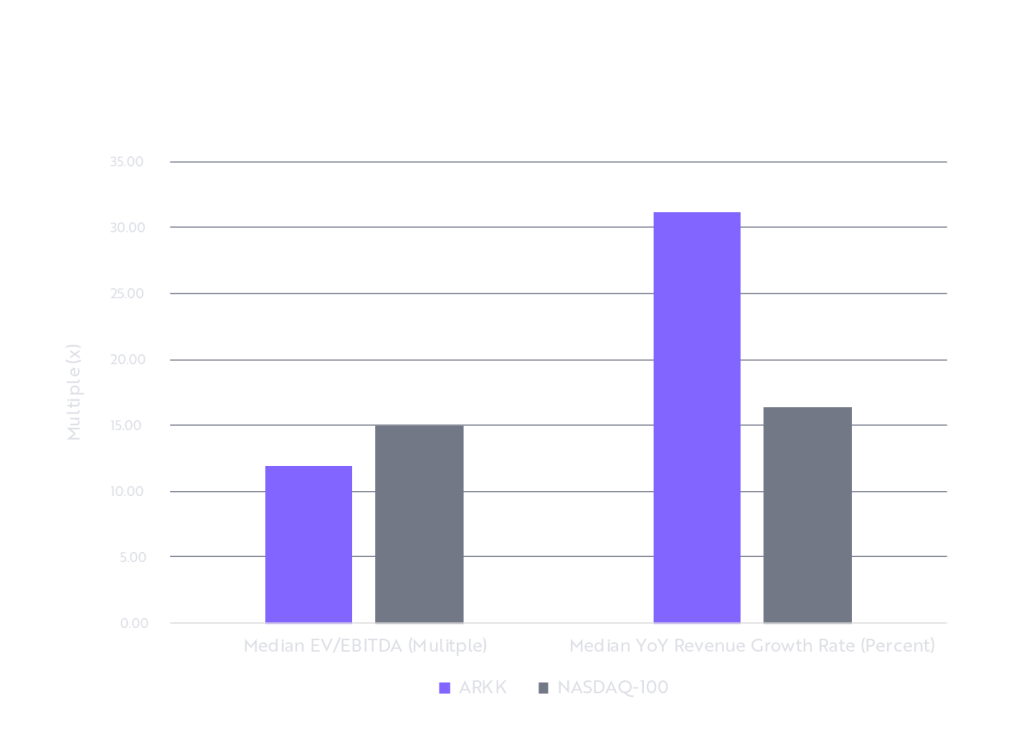
Source: ARK Investment Management LLC, 2022. Data as of Q2 2022. Enterprise Value is as of 9.30.22.
Forecasts are inherently limited and cannot be relied upon.
For informational purposes only and should not be considered investment advice or a recommendation to buy, sell, or hold any particular security or cryptocurrency.
Cash Burn’s Impact On The Growth Potential Of Early Stage Companies
Even though the equity and bond markets are open for funding, many analysts are focused on cash burn as the limiting factor to innovation and growth. In 2008-09, the markets seized up and precluded financing, which is not the case today. That said, we have calculated the years of cash that ARKK’s companies have on hand to support growth if current cash burn rates do not improve, as shown below. In the absence of improved fundamentals, the cash on the balance sheet of ARKK’s companies would last a median of roughly five years. Importantly, these figures do not reflect the discretionary nature of R&D, S&M, and SBC, which could be dialed down to preserve and extend the cash burn timeline. These results evidence the sustainability of these companies through a business cycle.
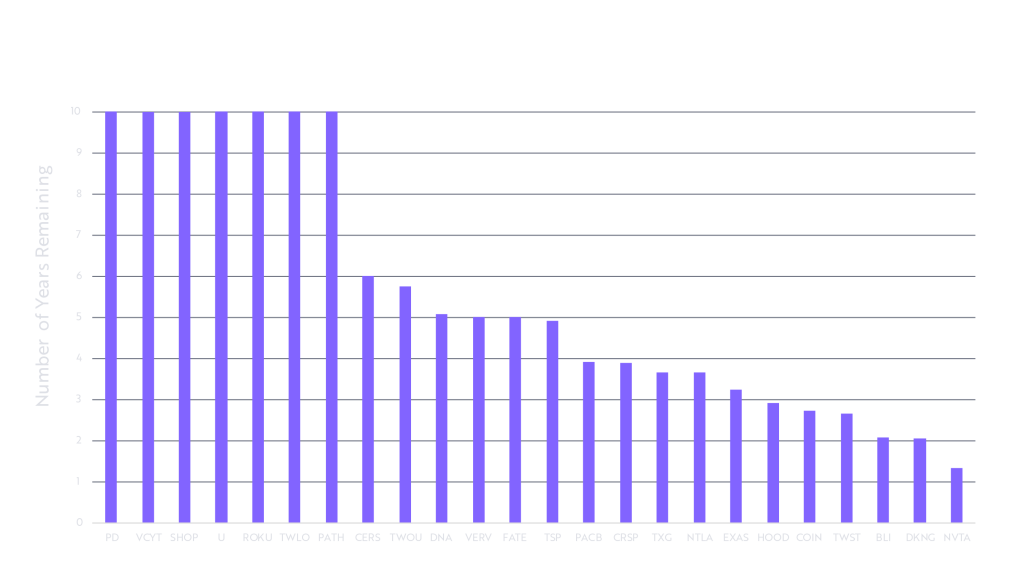
Source: ARK Investment Management LLC, 2022. Data as of 11.21.22. Analysis is representative of free cash flow in respect to cash and marketable securities balances. It does not incorporate capital investment/capital structure and financing commitments. Chart scaled to a maximum of 10 years.Forecasts are inherently limited and cannot be relied upon.For informational purposes only and should not be considered investment advice or a recommendation to buy, sell, or hold any particular security or cryptocurrency.
Conclusion
After a 50-90% decline in the value of pure-play innovation strategies during the past 18 months as rising interest rates lowered the present value of future cash flows, equity markets seem to have bowed to GAAP-based EBITDA and shifted toward defensive low-growth strategies. We believe GAAP-based EBITDA falls short when measuring the longer-term growth and profitability profile of early stage, rapidly growing, innovative companies. In our view, the long-term profitability and equity performance of so-called “profitless tech” companies will dwarf those of companies that have catered to short-term oriented shareholders with share repurchases and dividends, at the expense of investing in the future.
Important Information
Past performance does not guarantee future results.
ARK’s actively managed ETFs are benchmark agnostic. Index performance provided as a general market indicator. Indexes are unmanaged. It is not possible to invest directly in an index.
Investors should carefully consider the investment objectives and risks as well as charges and expenses of an ARK ETF before investing. This and other information are contained in the ARK ETFs’ prospectuses, which may be obtained by visiting www.ark-funds.com. The prospectus should be read carefully before investing.
An investment in an ARK ETF is subject to risks and you can lose money on your investment in an ARK ETF. There can be no assurance that the ARK ETFs will achieve their investment objectives. The ARK ETFs’ portfolios are more volatile than broad market averages. Additional risks of investing in ARK ETFs include equity, market, management, and non-diversification risks, as well as fluctuations in market value and NAV. The ETF’s portfolio is more volatile than broad market averages. Shares of ARK ETFs are bought and sold at market price (not NAV) and are not individually redeemed from the ETF. ETF shares may only be redeemed directly with the ETF at NAV by Authorized Participants, in very large creation units. There can be no guarantee that an active trading market for ETF shares will develop or be maintained, or that their listing will continue or remain unchanged. Buying or selling ETF shares on an exchange may require the payment of brokerage commissions and frequent trading may incur brokerage costs that detract significantly from investment returns.
Cash flow is the total amount of money being transferred into and out of a business, especially as affecting liquidity.
The principal risks of investing in the ARK ETFs include: Equity Securities Risk. The value of the equity securities the ARK ETF holds may fall due to general market and economic conditions. Foreign Securities Risk. Investments in the securities of foreign issuers involve risks beyond those associated with investments in U.S. securities. Disruptive Innovation Risk. Companies that ARK believes are capitalizing on disruptive innovation and developing technologies to displace older technologies or create new markets may not in fact do so. Companies that initially develop a novel technology may not be able to capitalize on the technology. Companies that develop disruptive technologies may face political or legal attacks from competitors, industry groups or local and national governments. These companies may also be exposed to risks applicable to sectors other than the disruptive innovation theme for which they are chosen, and the securities issued by these companies may underperform the securities of other companies that are primarily focused on a particular theme. Special Purpose Acquisition Companies (SPAC) Risk. A SPAC is a publicly traded company that raises investment capital for the purpose of acquiring or merging with an existing company. Investments in SPACs and similar entities are subject to a variety of risks beyond those associated with other equity securities. Because SPACs and similar entities do not have any operating history or ongoing business other than seeking acquisitions, the value of their securities is particularly dependent on the ability of the SPAC’s management to identify a merger target and complete an acquisition. The ARK ETFs also have specific principal investment risks, which are described below. More detailed information regarding these risks can be found in the ARK ETFs’ prospectuses.
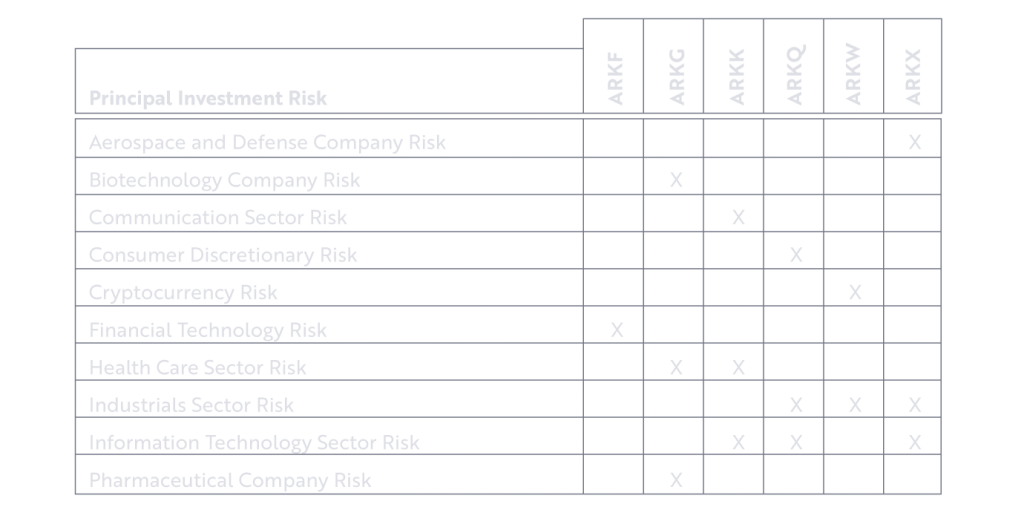
Aerospace and Defense Company Risk. Companies in the aerospace and defense industry rely to a large extent on U.S. (and other) Government demand for their products and services and may be significantly affected by changes in government regulations and spending, as well as economic conditions, industry consolidation and other disasters.
Biotechnology Company Risk. A biotechnology company’s valuation can often be based largely on the potential or actual performance of a limited number of products and can accordingly be greatly affected if one of its products proves, among other things, unsafe, ineffective, or unprofitable. Biotechnology companies are subject to regulation by, and the restrictions of, the U.S. Food and Drug Administration, the U.S. Environmental Protection Agency, state and local governments, and foreign regulatory authorities.
Communications Sector Risk. Companies is this sector may be adversely affected by potential obsolescence of products/services, pricing competition, research and development costs, substantial capital requirements and government regulation.
Consumer Discretionary Risk. Companies in this sector may be adversely impacted by changes in domestic/international economies, exchange/interest rates, social trends, and consumer preferences.
Cryptocurrency Risk. Cryptocurrency (notably, bitcoin), often referred to as ‘‘virtual currency’’ or ‘‘digital currency,’’ operates as a decentralized, peer-to-peer financial exchange and value storage that is used like money. The Fund may have exposure to bitcoin, a cryptocurrency, indirectly through an investment in the Bitcoin Investment Trust (‘‘GBTC’’), a privately offered, open-end investment vehicle. Cryptocurrency operates without central authority or banks and is not backed by any government. Even indirectly, cryptocurrencies may experience very high volatility and related investment vehicles like GBTC may be affected by such volatility. As a result of holding cryptocurrency, the Fund may also trade at a significant premium to NAV. Cryptocurrency is also not legal tender. Federal, state, or foreign governments may restrict the use and exchange of cryptocurrency, and regulation in the U.S. is still developing. Cryptocurrency exchanges may stop operating or permanently shut down due to fraud, technical glitches, hackers, or malware. Many significant aspects of the U.S. federal income tax treatment of investments in bitcoin are uncertain and an investment in bitcoin may produce income that is not treated as qualifying income for purposes of the income test applicable to regulated investment companies, such as the Fund. GBTC is expected to be treated as a grantor trust for U.S. federal income tax purposes, and therefore an investment by the Fund in GBTC will generally be treated as a direct investment in bitcoin for such purposes. See ‘‘Taxes’’ in the Fund’s SAI for more information.
Financial Technology Risk. Companies that are developing financial technologies that seek to disrupt or displace established financial institutions generally face competition from much larger and more established firms. Fintech Innovation Companies may not be able to capitalize on their disruptive technologies if they face political and/or legal attacks from competitors, industry groups or local and national governments. Blockchain technology is new and many of its uses may be untested. Blockchain and Digital commodities and their associated platforms are largely unregulated, and the regulatory environment is rapidly evolving. As a result, companies engaged in such blockchain activities may be exposed to adverse regulatory action, fraudulent activity or even failure.
Health Care Sector Risk. The health care sector may be adversely affected by government regulations and government health care programs, restrictions on government reimbursements for medical expenses, increases or decreases in the cost of medical products and services and product liability claims, among other factors. Many health care companies are heavily dependent on patent protection and intellectual property rights and the expiration of a patent may adversely affect their profitability.
Industrials Sector Risk. Companies in the industrials sector may be adversely affected by changes in government regulation, world events and economic conditions. In addition, companies in the industrials sector may be adversely affected by environmental damages, product liability claims and exchange rates.
Information Technology Sector Risk. Information technology companies face intense competition, have limited product lines, markets, financial resources, or personnel, face rapid product obsolescence, are heavily dependent on intellectual property and the loss of patent, copyright and trademark protections may adversely affect the profitability of these companies.
Pharmaceutical Company Risk. Companies in the pharmaceutical industry can be significantly affected by, among other things, government approval of products and services, government regulation and reimbursement rates, product liability claims, patent expirations and protection and intense competition.
Certain of the statements contained in this presentation may be statements of future expectations and other forward-looking statements that are based on ARK’s current views and assumptions and involve known and unknown risks and uncertainties that could cause actual results, performance, or events to differ materially from those expressed or implied in such statements. The matters discussed in this presentation may also involve risks and uncertainties described from time to time in ARK’s filings with the U.S. Securities and Exchange Commission. ARK assumes no obligation to update any forward-looking information contained in this presentation. ARK and its clients as well as its related persons may (but do not necessarily) have financial interests in securities or issuers that are discussed. Certain information was obtained from sources that ARK believes to be reliable; however, ARK does not guarantee the accuracy or completeness of any information obtained from any third party.
Index Descriptions:
The S&P 500® Index is a widely recognized capitalization-weighted index that measures the performance of the large-capitalization sector of the U.S. stock market.
The NASDAQ-100 Index is a stock market index that includes 100 of the largest, most actively traded, non-financial companies that are listed on the Nasdaq Stock Market.
The NASDAQ Composite is a stock market index that includes almost all stocks listed on the Nasdaq stock exchange. Along with the Dow Jones Industrial Average and S&P 500, it is one of the three most-followed stock market indices in the United States.
ARK ETFs are distributed by Foreside Fund Services, LLC.
©2021-2026, ARK Investment Management LLC. No part of this material may be reproduced in any form, or referred to in any other publication, without the express written permission of ARK Investment Management LLC (“ARK”).
https://research.ark-invest.com/innovation-why-now
As of 9/30/22.
Please see ARKK’s top ten holdings here: https://ark-funds.com/funds/arkk/
We return to the Tesla example below.
Normalization treatment discussed below.
As of 9/30/22.
The adjustment rates are based on the Nasdaq 100’s (QQQ ETF is used) median spend as percent of revenue, which serves as a mature company proxy.
https://www.ifrs.com/ifrs_faqs.html
https://www.ifrs.org/issued-standards/list-of-standards/ias-38-intangible-assets/
Since this analysis, ARK has effectively exited out of the TuSimple position. Please note, however, that an immaterial number of shares remain in the fund to facilitate the ETF creation and redemption functionality.
https://seekingalpha.com/article/4551451-tusimple-holdings-inc-tsp-q3-2022-earnings-call-transcript
ARK’s statements are not an endorsement of any company or a recommendation to buy, sell or hold any security. ARK and its clients as well as its related persons may (but do not necessarily) have financial interests in securities or issuers that are discussed. Certain of the statements contained may be statements of future expectations and other forward-looking statements that are based on ARK’s current views and assumptions and involve known and unknown risks and uncertainties that could cause actual results, performance, or events to differ materially from those expressed or implied in such statements.

ARK Trade Notifications
ARK offers fully transparent Exchange Traded Funds (“ETFs”) and provides investors with trade information for all actively managed ETFs.
